skip to Main Content

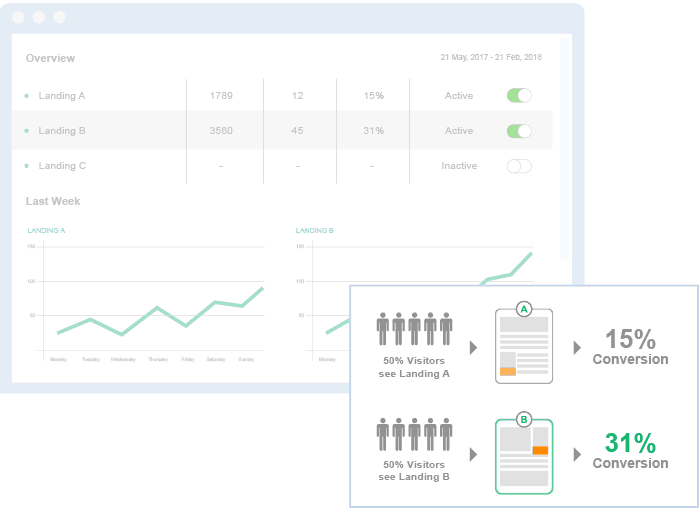
Landing page A/B testing allows you to sell more keeping your ad spend the same. Let’s say you invest $500/month in Google AdWords to drive traffic to a landing page. That landing page generates 10 clients every month. Each client makes you $100 in profit, for a total of $1,000/month. Now, imagine you could split the traffic in half: 50% goes to the same landing page A, while the other 50% lands on a variation of the page, the landing page B. You find out that the landing page B generates 15 clients per month. This means +$500/month from the exact same ad spend.
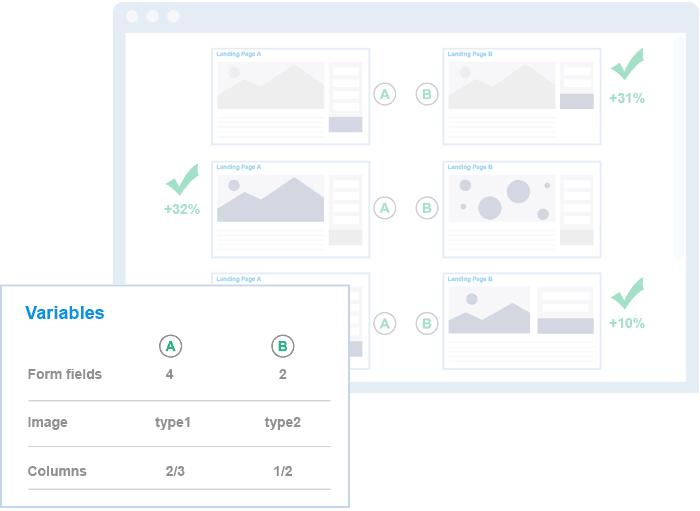
Landing page A/B testing

Step 1. Identifying your Goal

Whether you want to collect emails, get people to download your ebook, call you or anything else; focus on one goal at the time.

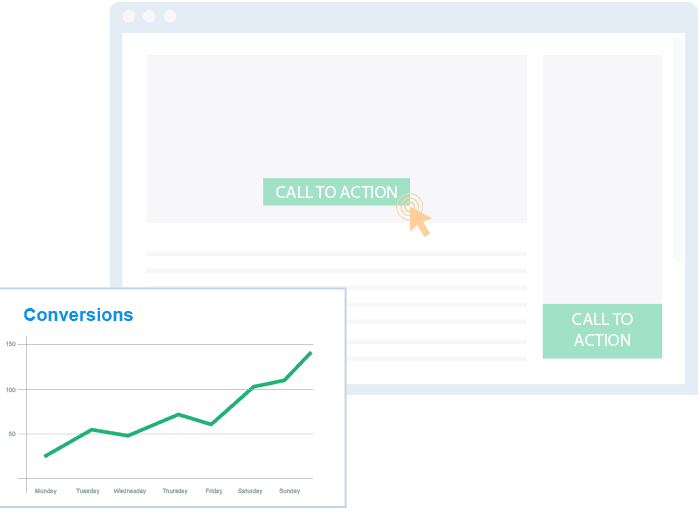
It makes a tremendous difference in Conversions when you have one, clear, Call-to-Action on a landing page, rather than multiple.

We will sit down and discuss with you about this crucial first step.

Step 2. Choosing a Variable to test

There are many variables that can be tested. However, we start by picking one.

By isolating one “independent variable”, we can check its performance. We know that little changes can make a big difference, so we will test them carefully.

A variable could be amount of Body Text, Headline copy, CTA position, number of Form Fields etc.

Step 3. Designing the Landing Pages

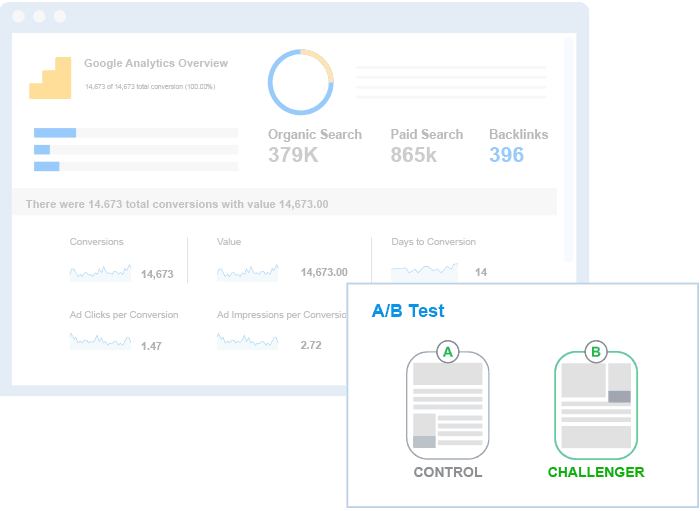
Landing page A/B testing consists of a “Control” and a “Challenger” page​. When we design a control page (landing page A), we start by evaluating the existing data.

Once we have designed a draft, we’ll begin to collect qualitative data, by running UX tests, surveys etc. If you have Google Analytics installed, we start from there.

The next step involves creating a challenger (or landing page B) to test against A. After some time we’ll have enough insight to start making hypothesis.

Step 4. Running the Test

We run a test for a minimum of 7 days or until we have at least a 95% chance that the “challenger” beats the “control” page.

We run our tests using sophisticated software, like Optimizely and Visual Website Optimizer.

Besides, we add Heatmaps and Clickmaps to the mix, to gain an extra insight of how visitors interact with the landing pages.

Step 5. Measuring Results

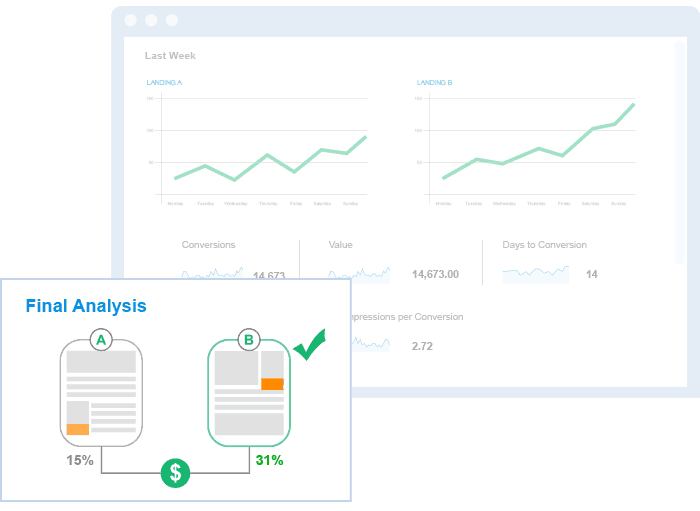
It’s time to analyze if the results collected are statistically significant to justify a change.

If they are, great! If they’re not, we just learned that the variable doesn’t affect the results. In any case, we learn.

By conducting a new landing page A/B test on a different feature, we guarantee a constant improvement regarding ROI.

Back To Top